Redesign of the Jungle Rhythms webpage
I decided to redesign the webpage of the Jungle Rhythms project. The previous web page only served as a portal to the Zooniverse citizen science project. The project is finished, and so a place to host more content, such as details on the dataset and visualizations was needed. I alos copied over old blog posts from my personal blog to aggregate those on this new website as well.
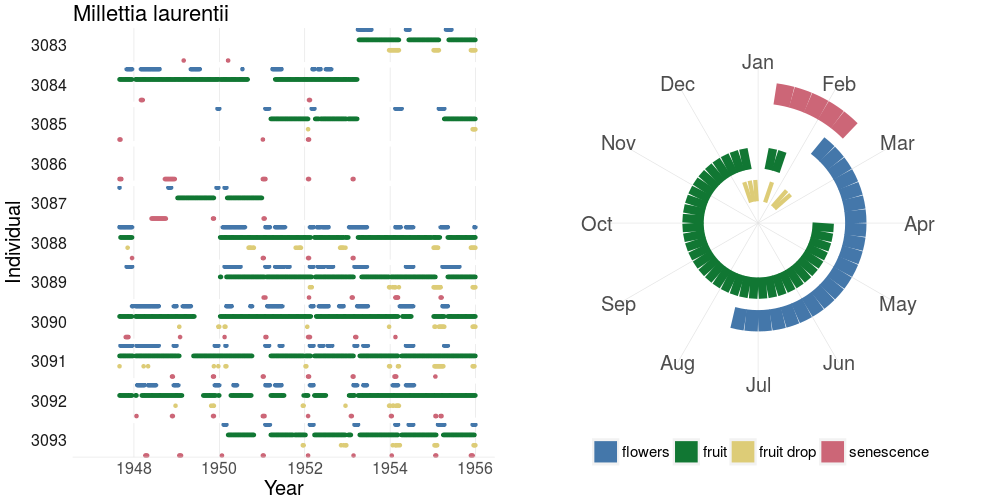
In addition to the blog, and links to team member, contact information etc. I visualize a first dataset using summary graphs as those below. These graphs combine both a linear and circular concept of time. Where the left panel shows all individuals and all years recorded the right panel will condense this data using a majority vote to highlight the dominant recurrent patterns for a given species over the course of a year.
You can find visualizations for a large number of species (409) on the data visualization page. A full description of the data presented there is given on the About the data page.